I’m a huge fan of the C4 Model for documenting IT systems and IT-landscapes. It enables us capture complex architectural information in a simple way that can be consumed by both engineers and management alike. One of the ways C4 achieves this feat is by hiding the details! Including too much detail, or to include it in an inconsistent way in your architecture diagrams make them difficult to read for a wide audience.
The C4 model was invented by Simon Brown and he describes it as follows:
The C4 model is an easy to learn, developer friendly approach to software architecture diagramming. Good software architecture diagrams assist with communication inside/outside of software development/product teams, efficient onboarding of new staff, architecture reviews/evaluations, risk identification (e.g. risk-storming), threat modelling, etc.
Simon Brown
Simon has a great video describing the C4 Model here.
Abstraction Levels in C4
C4 defines several “zoom levels” which can be used to see architecture at different levels of abstraction. If you haven’t already visited the website and watched the video I strongly encourage you to do this now as it gives an excellent overview.
Let’s use the analogy of a map. You have a world map, a country map and a city map, for example. They are all maps and they all are showing visualisations about the same underlying model (the Earth, it’s geography and human made structures etc.). We do not aim to show all information at all abstraction levels. Showing streets and every small village or tree location on a world map would make the map unusable.
Which of these maps we use depends on our use-case. If I’m planning a long distance flight for my vacation, I may use a world map. If I’m trying to find a place near to me where I can find a good cup of coffee I’m going to use a high detail city map.
The same is true of architecture diagrams! Management don’t care which protocol is in use between two micro-services, or that there is a shared database between two components. Management may perhaps want to see which external systems we are connected to.
An engineer certainly does care if an API is RESTful or GraphQL based and will want perhaps even see which classes are in use.
C4 defines four levels of abstraction.
- Level 1 – System Context Diagram
- Level 2 – Container Diagram
- Level 3 – Component Diagram
- Level 4 – Code Diagram
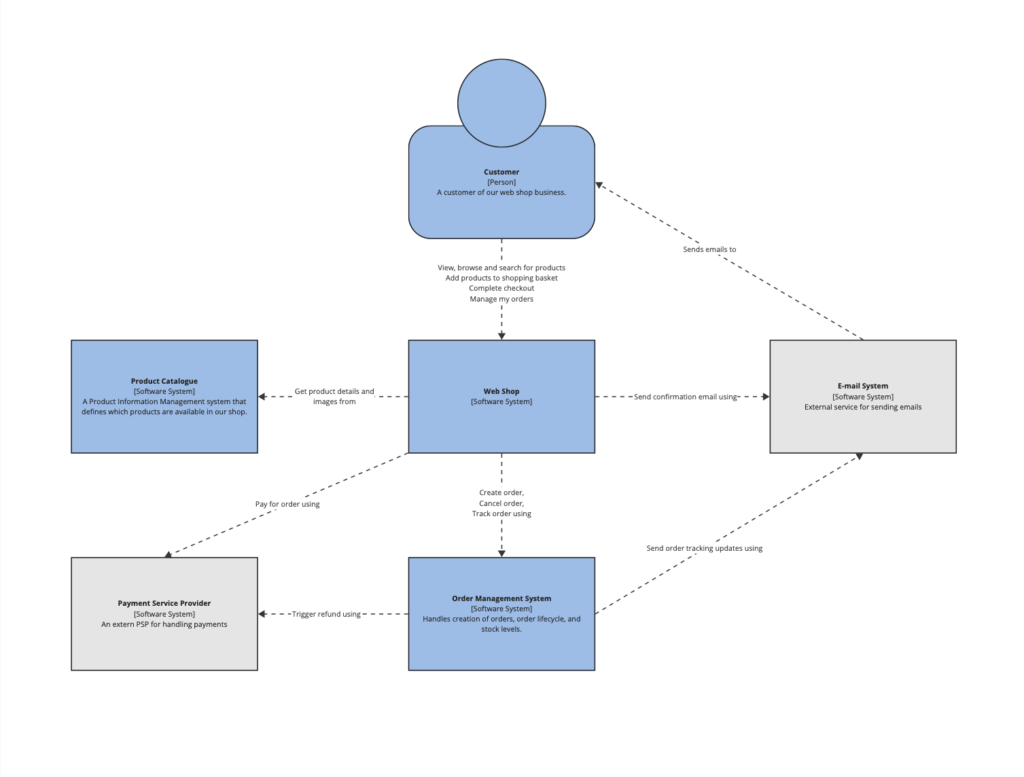
Let’s look at each of these levels in more detail, with a realistic example of an online web shop.
Level 1 – System Context Diagram
The first level of abstraction is a zoomed out view of your system, which stakeholders or “actors” interact with it and for what reasons as well as which other systems it relates to (and why).
At this level we do not show protocols and do not discuss services at all. We simply show on a high level how these things relate. Indeed at this abstraction level your system is still a black-box.
Level 2 – Container Diagram
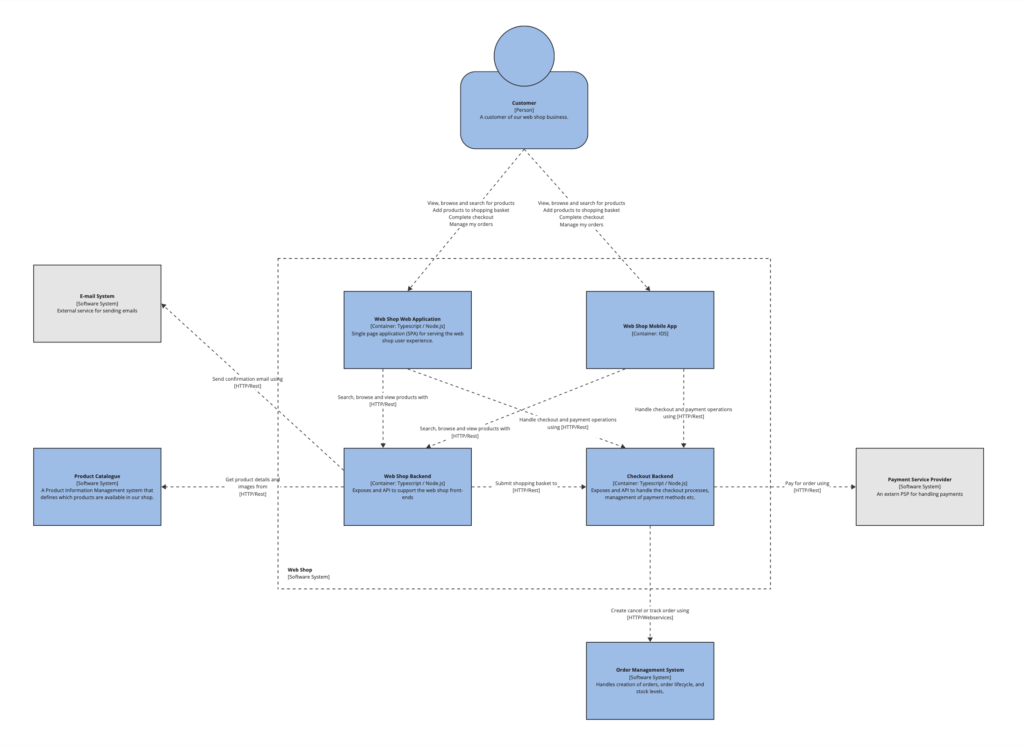
Here we open the system itself and make the internal parts visible. Inside a system are “Containers”. These typically are the big parts of your System, including front-ends, back-ends, mobile apps, databases.
A good rule of thumb is that if the code is managed in a source code repository that’s probably a separate container (unless you’re using a mono-repo pattern).
We are still able to see the same relationships to external systems as before, but we now see from which internal containers specifically are related to those external systems.
Level 3 – Component Diagram
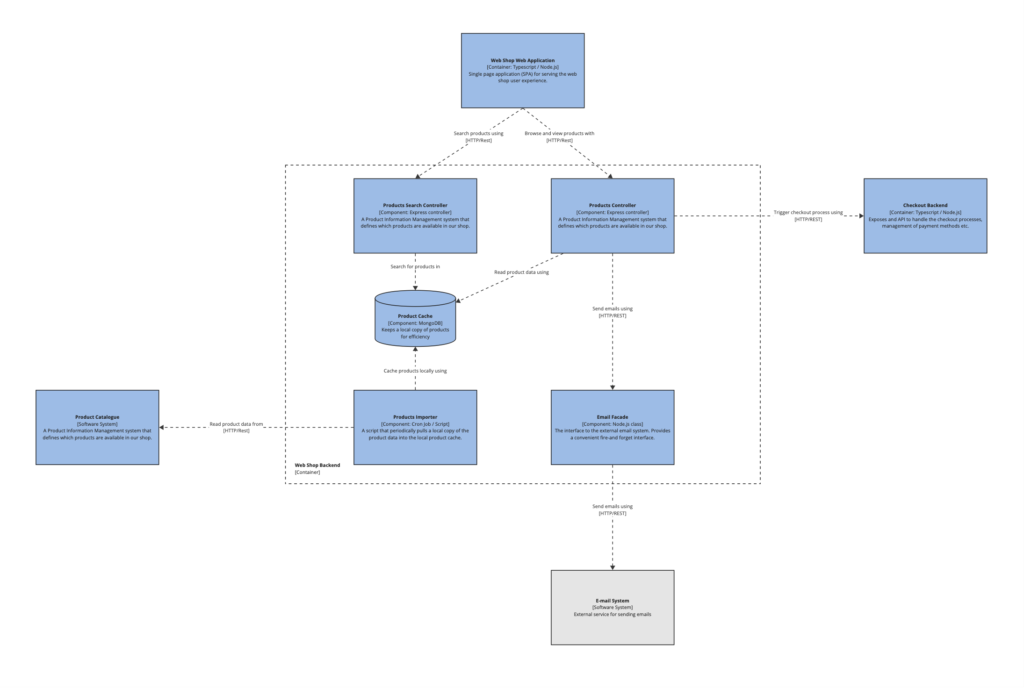
To descend into Level 3 we open up one of the containers to expose the components within. A component is an internal part of one container. This could be a module, package or logical groups of classes within your code base.
The C4 Website has a “Controller” as a Component, for example. While this may be a single class, it more often contains a multitude of adapters, mappers, filters and validators and so on which we can just group together into a “Controller” component.
Level 4 – Code Diagram
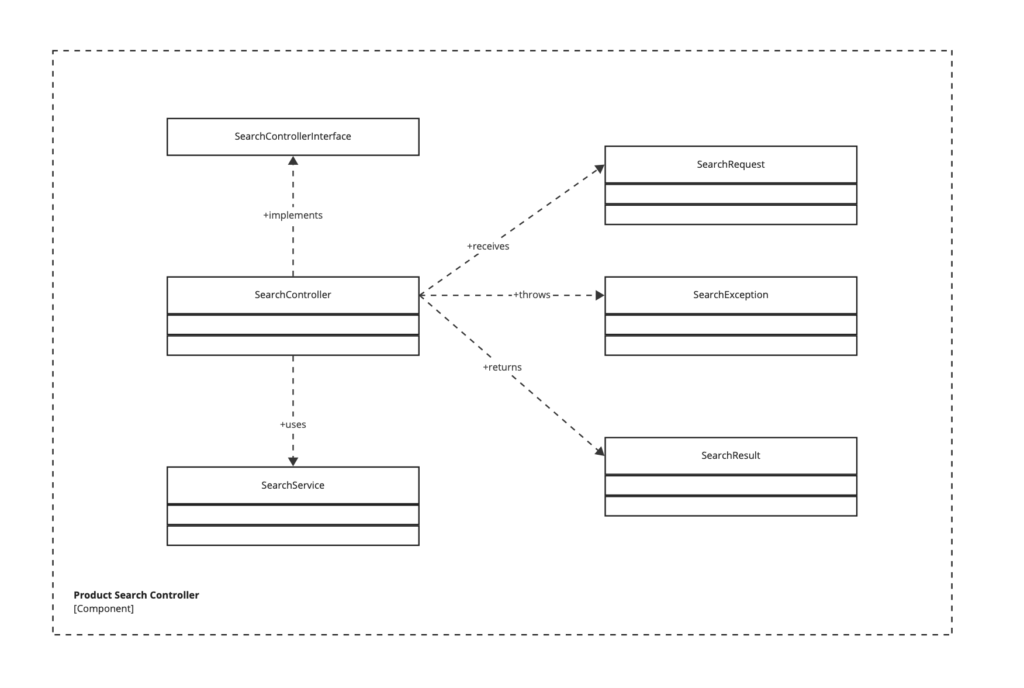
Level 4 deals with code itself. Here we have really dived into the class design. I don’t generally bother descending to this level as I believe this level of documentation provides a poor return on investment for the time taken to model it. IDEs these days are so good that I can easily browse the code and the class relationships directly, and as this is the real code I know it is up to date.
You can use the C4 model to document at this level, however, if your use-case justifies it.
C4 Model Tips and Tricks
Tip #1 – Forget about level 3 and 4 (unless you really need them)
If you are a higher level architect, you probably will gain most value from level 1 (context) and level 2 (containers). Unless you are actively involved in the development or maintenance of a component, the deeper levels of C4 aren’t very interesting.
Additionally, the cost and maintenance effort to document levels 3 and 4 increases rapidly for non-trivial projects, and these will provide diminishing returns. The codebase may also be changing from day-to-day, so it will also be an ongoing cost to maintain such diagrams unless generating them can be automated from the code itself.
Navigation of a code base and even visualisation of classes and their relationships is a feature of many modern IDEs, so the value of investing time in documenting this seems dubious.
Tip #2 – Keep relations logical on the higher levels
Imagine modelling an IT system where all the components communicate via an API Gateway. This gateway can be shown as a component itself, and all systems connect to it and no systems interact with each other directly at all.
While this may be technically correct, such a diagram looks a bit like a spider, where all systems interact with a central hub. This does not help us to understand how components relate to each other well at all.
If we were to remove the API Gateway and show the logical relationships between the components themselves, the diagram becomes much more useful. You can keep the information that an API Gateway is involved by pushing this into the relationship descriptions, similarly to how relationships can describe the communication protocol e.g. “[REST via API Gateway)]”

This tip is also relevant if you use an Enterprise Service Bus, event queues, Kafka or other communication infrastructure components. Think at all times, which representation is most useful to the audience at this abstraction level.
Tip #3 – Hide your private databases
Not all databases are created equal!
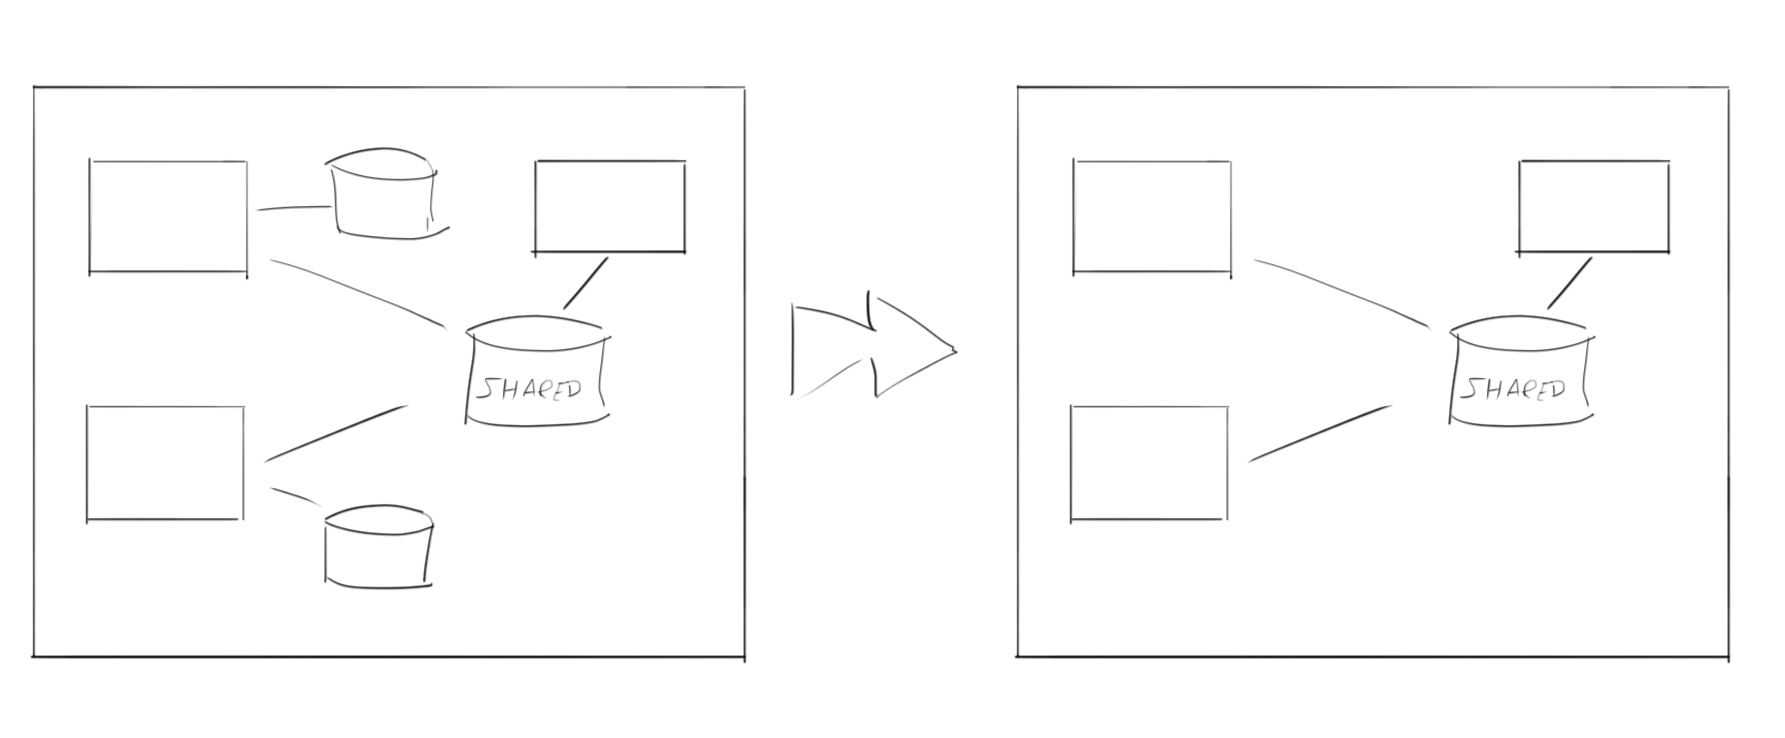
In the container view (level 2), it is quite common to see databases modelled as containers. While this is really helpful for shared databases, where it is helpful for seeing which other containers depend upon it and why, it can create a lot of unnecessary noise if these are merely private databases. As a higher level architect I probably don’t care if a team uses a MongoDB or an Oracle database internally. This would be just an implementation concern and so, for such cases, I would relegate these to the next level down and model them as components (in the 3rd level down in the C4 approach).
The same tip also applies to content or blob storage. If these are only used privately, consider them an implementation detail and keep them hidden on level 2. If they are shared between containers, consider it a first-class citizen of your container diagram.
Tip #4 – Reflect on the direction of your arrows
Many people want to use bi-directional relationships in their C4 diagrams. This isn’t recommended as there is usually an upstream and a downstream system in any system-to-system relationship and it is very helpful to visualise this. Remember, the direction of the arrow does not mean only the direction of network traffic (It is more abstract than that). A container may call the API of another and then receive a back-channel of data via a web socket, but on a logical level, there is still one system requesting data from another and it is these logical relationships we should try to capture. Think about which side of the relationship plays the “active” or “initiating” role and which is the “recipient”, or “serving” party.
While there may be real cases where a bi-directional arrow is needed, it is worth spending a few minutes to really consider if this can indeed be represented using a simple uni-directional relationship. Where there are real bi-directional relationships, this may be an indication of a poor design.
Tip #5 – Be smart about your colour coding
Using colours in a C4 diagram can be very expressive and provide a whole dimension of visual information. The C4 model web page does not give strict rules for how to apply them and leaves it up to you to decide on an interpretation.
I sometimes use the convention of having internally hosted systems in blue and externally hosted systems in grey, while others use colours to indicate bespoke vs. provided. Im sure there are many other approaches, but it’s worth thinking about what information is most important to communicate for your own specific circumstances.
Is it important at all to be able to identify bespoke vs. provided system? Perhaps your company doesn’t work at all with external interfaces. Perhaps there are alternative ways to show what you want to show so you can use the colour scheme for another purpose.
There are also going to be some special cases where software is hosted externally, but customised in-house by a development team (e.g. a CRM solution hosted in the cloud). Is this bespoke, or provided?
Whatever solution you choose, be thoughtful about it, make sure the colour scheme communicates something useful, keep it simple, and don’t forget to explain your colour scheme in a key on your diagram.
Tip #6 – Model relationships outside your system (if relevant)
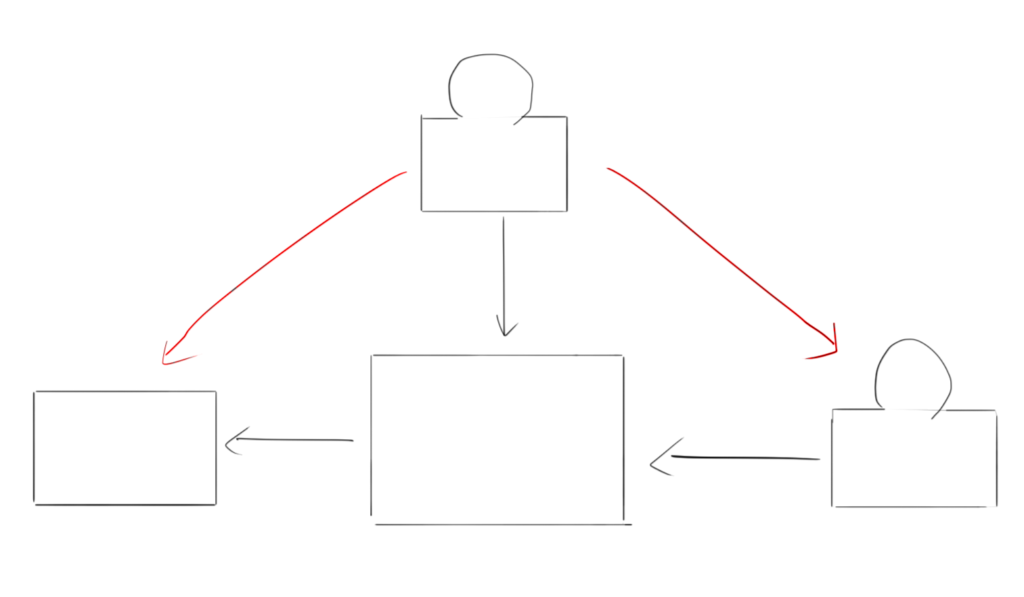
The example system context diagram given on the C4Model webpage shows the Internet Banking System in the middle and the incoming and outgoing relationships from that to neighbouring systems and the actor. There is one very interesting line, however, showing how the E-mail System sends an email to the Personal Banking Customer actor. This line is interesting because it is not directly part of the Internet Banking System in question.
Sometimes, externals systems have relationships with each other which are really helpful to the understanding of the system itself which we may forget about when drawing our C4 models.
Consider taking this approach too where actors interact with other actors in some relevant way. Perhaps the Customer actor sends a physical letter to a Mail Room Agent and both of these actors then take action on our system as part of this process. This relationship is interesting and relevant for understanding the system, so go ahead and model the relationship (it is part of the context).
Tip #7 – Be cautious when trying to unify all your diagrams
It can be tempting to try to link all your system diagrams together. Each team can provide the model and diagram for their own systems and we can connect everything in a giant unified system landscape diagram.
This is a worthy idea, but implementing is challenging for any non-trivial organisation. Keeping everything maintained and ensuring consistency across teams, with a distributed model ownership approach, is hard.
Different teams may cluster components in slightly different ways and have different approaches regarding colour schemes or understandings of abstraction levels (i.e. what is a container vs. a stand-alone system). Aligning multiple groups to a standardised approach is challenging and time consuming.
Consider accepting many fragmented diagrams and the value these can provide and what benefit you hope to gain from this giant unification. Then, please, consider the logistical challenges for your organisation. Does the benefit really outweigh the cost? What tooling can you leverage when attempting this? How will this be maintained on an on-going basis?
If you have managed to make this approach work well, over an extended period of time, I would love to hear from you!
Tip #8 – Think about tooling
Remember that creating a single diagram is not the end of the story. We probably need to maintain the diagrams on an on-going basis and keep them up to date. We may need to work with other team members to create these diagrams. There are tools to support you in these regards.
Miro is a great tool for general collaborative diagramming, but does not provide dedicates C4 objects. It is still possible to make very nice diagrams using this tool.
Draw.io is a good tool for simply drawing architecture diagrams of all types (including C4).
Structurizr allows you to use a DSL language to create diagrams. This lets you check in your code to source control and to keep it in close proximity to the source code which it may be documenting. If you want to export the latest version of your diagrams in your CI pipelines whenever the source code changes, this is probably the tool for you.
Icepanel is also an interesting tool enabling a collaborative approach to documenting using the C4 approach.
Tip #9 – Define what you mean by a system (and how to cluster)
The top level of abstraction in the C4 Model is a system, but what does this really mean? If you’re working with monolithic applications then the meaning is simple, but what about in a service oriented architecture, or when using micro-services, or when working with a multitude of cloud functions. What does a system mean in these cases?
I’ve found it is really helpful to consider how to cluster things together and to align with development teams on if such a clustering is logically correct.
For example, a collection of micro-services might comprise a “Web Shop” application, which would make sense to model as a C4 System. A neighbouring team is working on a separate series of micro-services which forms the “Checkout”. This checkout could be considered part of the web shop system, or a separate system entirely, depending on who you ask (and possibly the day of the week). Such cases may indicate unclear boundaries in your IT Landscape and warrant deeper discussion and alignment.
I’ve found it helpful to look at team structures and ownership as a way to make such decisions. Is the checkout team working in a separate physical location, on a different cadence to the web shop team? Are there different management stakeholders for these? In which case, this may be an indicator to model these as separate systems. Are they co-located and mostly the same team members, following the same development processes and conventions, perhaps this is a single system.
How these micro-services are clustered will have an impact on if management considers these independent IT Systems, and may affect prioritisation and also governance. The same is true when working with cloud functions or other architecture styles. How you cluster is important, and may have wider implications for how your organisation manages these going forward.
Tip #10 – Remember it’s all about hiding details
The value of C4 diagrams comes as much from what they do not show as from what they do show. Indeed, this is what the 4 abstraction levels are all about. We want to hide as much detail as possible and only show things that are relevant for the audience at the flight-level in question.
We should, at all times, ask ourselves, is this detail needed? Can I get rid of it? Make each fact or detail fight for it’s life. If it cannot justify itself, push it downwards to a lower level. This will result in more useful, more maintainable diagrams that can be consumed by a larger number of viewers.
Limitations of the C4 Model
While the C4 Model has many uses, it is not a silver bullet for all your architectural modelling needs (no such thing exists). There are several areas where the C4 Model is going to be of limited use, especially when working on the level of enterprise architecture.
Modelling at the Enterprise Level
The C4 Model is not, for example, a good tool for modelling processes, capabilities, initiatives, teams, departments and other concepts that may be needed for a higher level view of an organisation.
The C4 Model is also not the right tool if you need to create an enterprise data model where you want to represent data objects or data components and associate them to applications.
For such cases a more specialised modelling tool is probably needed, such as Archi or LeanIX.
Tooling Limitations
While tooling for the C4 Model is improving, you are still generally going to need to think of your C4 diagrams as either diagrams, or models.
If you choose to go the model route, you’ll be creating models using a structured modelling language and generating the diagrams from this. This gives great flexibility as you can generate multiple diagram representations from a single model. You can also check this file into your source code management system and manage the change history over time. The diagrams themselves, however, being generated from these source files are not very pretty and may not be well arranged.
If you choose to make a diagram (i.e. a picture), you don’t have an underlying model backing your diagram. This means you essentially just have a single one-off picture. You can make this pretty and give it a great layout, but you miss out on all of the benefits of having the underlying model.
Conclusion
The C4 Model is an incredibly useful tool for your toolbox as an architect. To get the most out of this tool, you need to apply it to your own specific circumstances. Hopefully these tips and tricks will give you some ideas and inspiration to get as much value as possible from C4.
If you need help with your C4 diagrams, please get in touch.

